1. SCIENTIFIC VISUALIZATION: SOME BACKGROUND
Data visualization is the general and all-encompassing term for everything related to the graphic portrayal of information and data. Information visualization denotes data in an organized visual way to provide meaning [Friendly and Denis (2006)]. According to Friendly and Denis (2006), thematic cartography, statistical graphics, and data visualization histories are intertwined; their article lists 278 milestones of the concept of information visualization, starting with the supposed oldest known map dated 6200 BC. Apart from the visuals created with purely artistic or religious motivations, it is recognizable that the first creations were intended to aid navigation and exploration. These used geometric diagrams and tables to track the positions of stars and sky constellation elements. The birth of theories such as measurement errors, probability, and analytical geometry, provoked the scientific community’s mindset toward statistical theory and the systematic collection of empirical data. Inevitably, information visualization extended into new graphic forms, such as isolines, iso-contours, iso-surfaces and other techniques for thematic mapping of physical quantities such as geological, economic, and medical data [Friendly and Denis (2006)]. Because of the technological development in the 20th century, data visualization received significant attention, causing its permanent presence in the scientific field due to its effective way of conveying information. Friendly and Denis (2006) define scientific visualization as the area “primarily concerned with the visualization of 3D+ phenomena (architectural, meteorological, medical, biological, etc.), where the emphasis is on realistic renderings of volumes, surfaces, illumination sources, and so forth, perhaps with a dynamic (time) component”. In other words, in scientific visualization, the visual representations cannot be designed solely from the artistic inspiration of the creator but, by definition, must be based on scientific data identified as genuine and authentic in order to have scientific and academic applications (e.g., records, research, analyses, etc.).
2. FLOW VISUALIZATION
The only technique available a half-century ago to describe coherent structures in turbulent flows was smoke and dye injection [Brown and Roshko (1974); Winant and Browand (1974)]. According to Hesselink (1988), flow visualization results from the interaction between matter and light. The definition was based on the classical methods available in those years, such as shadow photography and Schlieren photography. In the early 1980s, other techniques were developed through numerical processing of flow visualization pictures for experimentally estimating some of the principal physical variables of fluid flows. That classical visualization relied on variations of the index of refraction or spatial derivatives of pressure, density, and temperature integrated along the light path through the fluid [Hesselink (1988)]. The Visualization Handbook (by Hansen and Johnson (2011)) describes flow visualization as a relevant topic of scientific visualization, intending to provide more understanding of fluid flows. Where typically, nowadays, the data is originated from numerical simulations, such as those of computational fluid dynamics (CFD). Visualization techniques have substantially evolved along with the world’s technology, spanning all disciplines [Sherman et al. (1997)]. Today visualization leans greatly on computers and numerical approaches because, in 20 years, the computing capacity has increased over three orders of magnitude.
3. VIRTUAL, AUGMENTED AND EXTENDED REALITY
Clarifying the difference between Virtual Reality (VR) and Augmented Reality (AR) requires an a priori explanation of the concept “virtuality continuum”, introduced 29 years ago by Milgram and Kishino (1994). They declared the continuum with four regions and argued that the taxonomy should be based on three sub-concepts, as follows: (i) “Extent of World Knowledge: The amount of information bleeding from the real environment into a virtual environment”; (ii) “Reproduction Fidelity: an attempt to quantify the image quality of the displays”; and (iii) “Extent of Presence Metaphor: a term to encapsulate the degree of immersion”. In other words, Milgram and Kishino (1994) described a continuum between the real world, which they call the “real environment”, and the “virtual environment” which is a fully synthetic world in which computer-generated signals are provided to the senses of a person in full replacement of the natural signals their senses normally perceive. This is what we are referring to as “Virtual Reality”. Between those two end points are various levels of mixing, the natural signals and the synthetic signals. In short, the difference between Virtual Reality and Augmented Reality is how the real world is treated. In Virtual Reality, the real (natural) world is hidden and the participant experiences only computer-generated stimuli to their senses, but in Augmented Reality, the participant fully experiences the real world with the addition of computer-generated signals to augment their real-world experience. There are different ways to achieve this mixing, the primary distinction is whether the real world is mediated through some type of video, or if the real world is perceived optically. Years later, Flavian et al. (2019) proposed a new taxonomy in five divisions, as shown in the Figure 3.1 below. Following the present interpretation, this continuum represents the classifications of the different modes a user can perceive sensory experiences and have their interactions.
Figure 3.1: Virtuality continuum, reproduced from Flavian et al. (2019).
From left to right in the Figure 3.1 above, the Real Environment is the physical world, where technology is not needed for its existence and interactions. Second is Augmented Reality (AR), where virtuality overlays reality yet does not interact with the whole physical world. AR usually requires a lens device so the user can visualize the virtual objects overlying the physical world. In the midway, it is the Pure Mixed Reality, where virtuality and reality are fused, explained as the generation of virtual objects with complete awareness of the real environment. The fourth is Augmented Virtuality (AV), where reality overlaps with virtuality, for example, a computer-generated display crowded with digital images but controlled by physical commands. The last taxonomy is the Virtual Environment, where the complete environment is digital and Virtual Reality is the medium used to access this mode [Bryson (2013)]. Any input from the real world has to be translated into a digital expression. The junction from AR to AV is called Mixed Reality (MR). At the same time, Extended Reality (XR) covers from AR to Virtual Environment, also commonly used as an unspecified reality mix.
Regarding flow visualization, such XR technologies benefit visual representation. It enables a researcher to perform scientific analysis and to gain a better insight into complex flows in complicated geometries that are hard to perceive with the naked eye at a fraction of the effort and cost required in a physical setup [Paeres et al. (2021b)]. For example, in the early 2000s, Aoki and Yamamoto (2000) proposed the design system for a 3-dimensional blade involving VR in turbomachinery. They showed how virtual reality could help a designer to visualize the 3-dimensional flow fields and modify the blade configuration to further calculate the results in an iterative approach. In a different project, Eissele et al. (2008) presented a system able to track position, orientation, and other additional aspects from a scenario used to influence the visualization. They observed automatically seeded streamlines rendered with halos to enhance the contrast to the underlying real-world image captured by a camera. Their work was focused on flow visualization in AR. However, they claimed that their approach could also be applied to other visualization tasks. In a more recent project, Walcutt et al. (2019) used virtual reality as a scalable and cost-efficient visualization mechanism to interpret large volumes of ocean data. They summarized ways where VR could be applied to the oceanography field and demonstrated the utility of VR as a 3-dimensional visualization tool for ocean scientists.
4. EQUIPMENT AND DEVICE DESCRIPTION
The Virtual Wind Tunnel (VWT) [Paeres et al. (2021b)] is a virtual environment created with the Unity game-engine platform to enhance user’s data visualization by immersively observing and interacting with any three-dimensional (3D) virtual object (i.e., static or dynamic), currently from Direct Numerical Simulation (DNS) results, but expandable to other computer-aid designs (CAD) and other scientific fields. We unified two software rarely related to each other (i.e., Unity and ParaView), extending the applications offered by these software to create an immersive (i.e., Virtual Reality and Augmented Reality) scientific visualization methodology, more specifically for CFD simulations. We expanded the capabilities of our VWT to work with the HTC Vive Pro 2 & Varjo XR-3 toolkits and GLTF files, a widely used standard file format for 3D scenes and models, especially for Mixed Reality. Also, we maintaining the compatibility with the HTC Vive VR kit and Microsoft HoloLens 1st gen. which are devices that many Mixed Reality (MR) enthusiasts have already acquired. The methodology is simple to replicate and uses open-source software, while the personal licenses are free. In MR, virtual objects can be invoked in the physical world with the ability of awareness and interactions, as was done in Paeres et al. (2021a, 2020).
Figure 5.1 depicts a user of the Varjo XR-3 kit visualizing turbulent streaks (positive and negative iso-surfaces of instantaneous streamwise velocity fluctuations) via Augmented Reality (AR) in ParaView. Three cases are displayed (cold, adiabatic and hot wall conditions) of DNS over supersonic turbulent boundary layers subject to concave and convex wall curvature.
Figure 4.1: HTC Vive VR toolkit 1st gen.
Figure 4.2: Microsoft HoloLens 1st gen. used for AR applications.
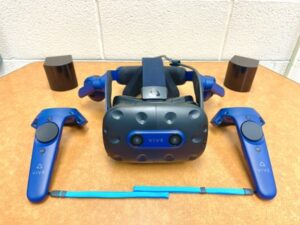
Figure 4.3: HTC Vive Pro 2 toolkit.
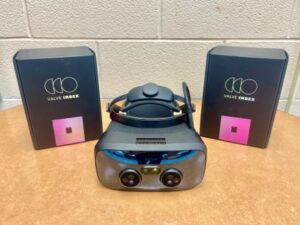
Figure 4.4: Varjo XR-3 toolkit.
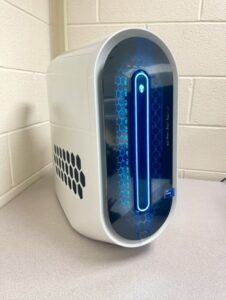
Figure 4.5: Dell Alienware Aurora R15. Configuration: 13thGen Intel(R) Core(TM) i9 13900KF 24-Core, 64GB RAM, NVIDIA(R) GeForce RTX(TM) 4090, 24GB GDDR6X.
5. The Virtual Wind Tunnel (VWT)
The Virtual Wind Tunnel (VWT) [Paeres et al. (2021b)] is a virtual environment created with the Unity game-engine platform to enhance user’s data visualization by immersively observing and interacting with any three-dimensional (3D) virtual object (i.e., static or dynamic), currently from Direct Numerical Simulation (DNS) results, but expandable to other computer-aid designs (CAD) and other scientific fields. We unified two software rarely related to each other (i.e., Unity and ParaView), extending the applications offered by these software to create an immersive (i.e., Virtual Reality and Augmented Reality) scientific visualization methodology, more specifically for CFD simulations. We expanded the capabilities of our VWT to work with the HTC Vive Pro 2 & Varjo XR-3 toolkits and GLTF files, a widely used standard file format for 3D scenes and models, especially for Mixed Reality. Also, we maintaining the compatibility with the HTC Vive VR kit and Microsoft HoloLens 1st gen. which are devices that many Mixed Reality (MR) enthusiasts have already acquired. The methodology is simple to replicate and uses open-source software, while the personal licenses are free. In MR, virtual objects can be invoked in the physical world with the ability of awareness and interactions, as was done in Paeres et al. (2021a, 2020).
Figure 5.1 depicts a user of the Varjo XR-3 kit visualizing turbulent streaks (positive and negative iso-surfaces of instantaneous streamwise velocity fluctuations) via Augmented Reality (AR) in ParaView. Three cases are displayed (cold, adiabatic and hot wall conditions) of DNS over supersonic turbulent boundary layers subject to concave and convex wall curvature.
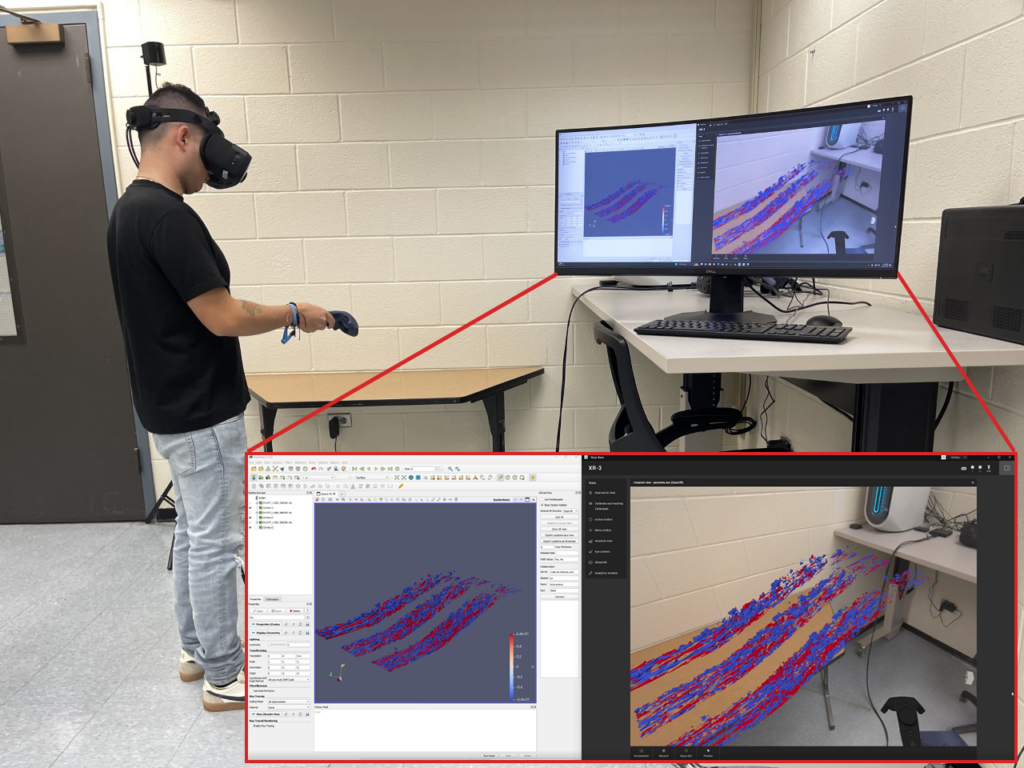
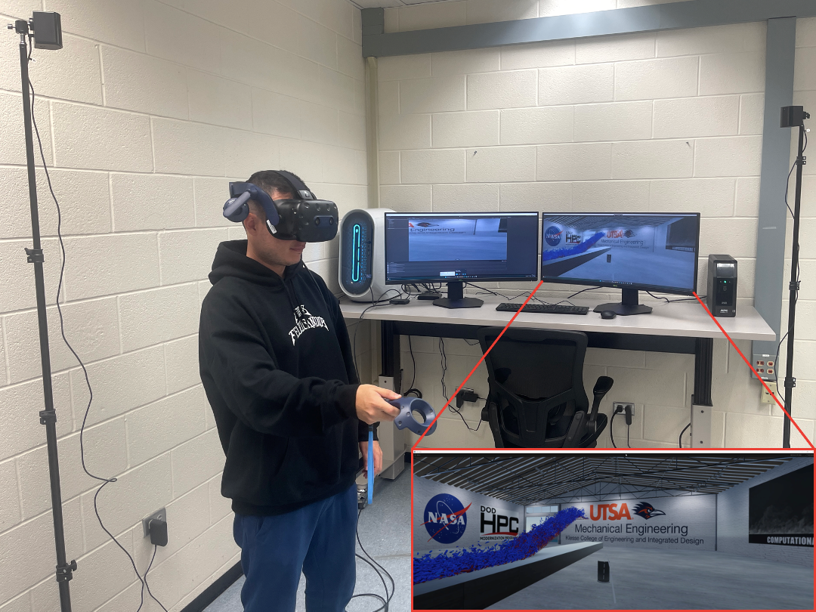
Figure 5.2: An HTC Vive Pro 2 user inside the Virtual Wind Tunnel (VWT).
6. Others Augmented Reality (AR) Applications
The benefits of designing the apps with Unity 3D are extending the AR applicability to Android and AR goggles devices (e.g., HoloLens) and increasing opportunities to develop interactive manipulations, such as image recognition, as shown in Paeres et al. (2021a) (see Fig. 6.1). Furthermore, Figure 6.2 shows the final result of an AR object invoked and placed over a table; this visualization was done through an iOS device with USDZ file extensions, displaying iso-surfaces of thermal fluctuations of supersonic turbulent boundary layers subject to strong concave-convex curvatures (positive values in red, i.e., hot fluid; and negative values in blue, i.e., cold fluid).
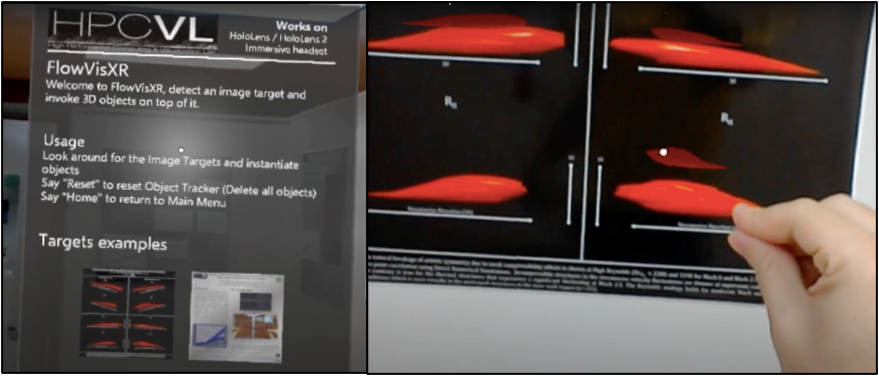
Figure 6.1: Image recognition from a poster display and Microsoft HoloLens
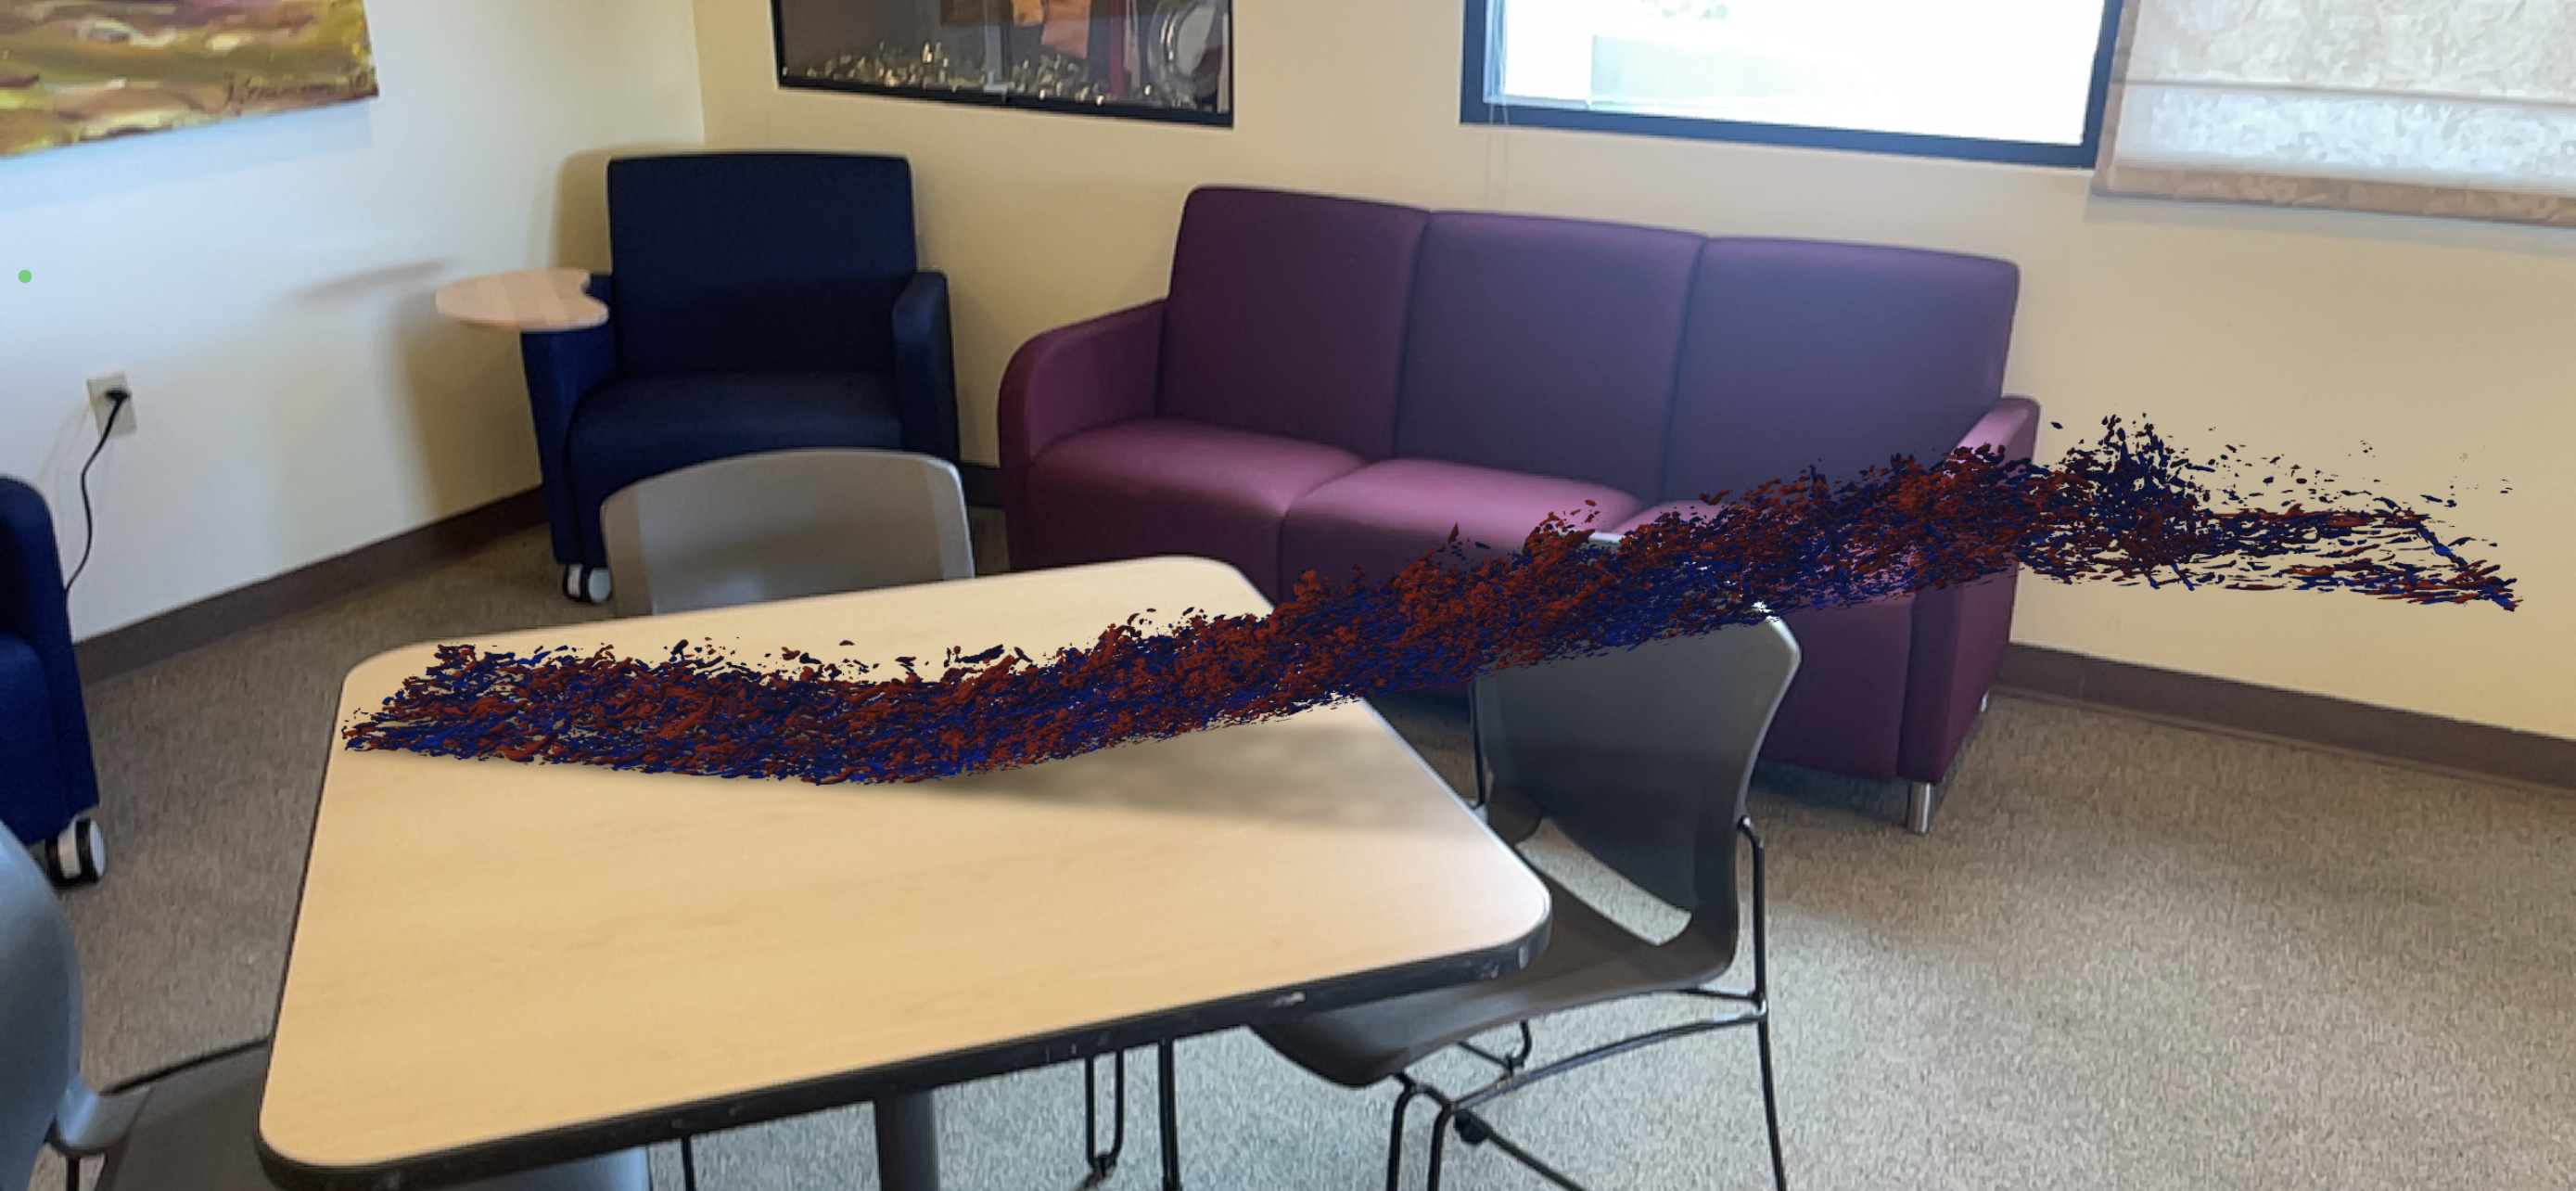
Figure 6.2: AR object (iso-surfaces of thermal fluctuations) visualized through an iOS device.
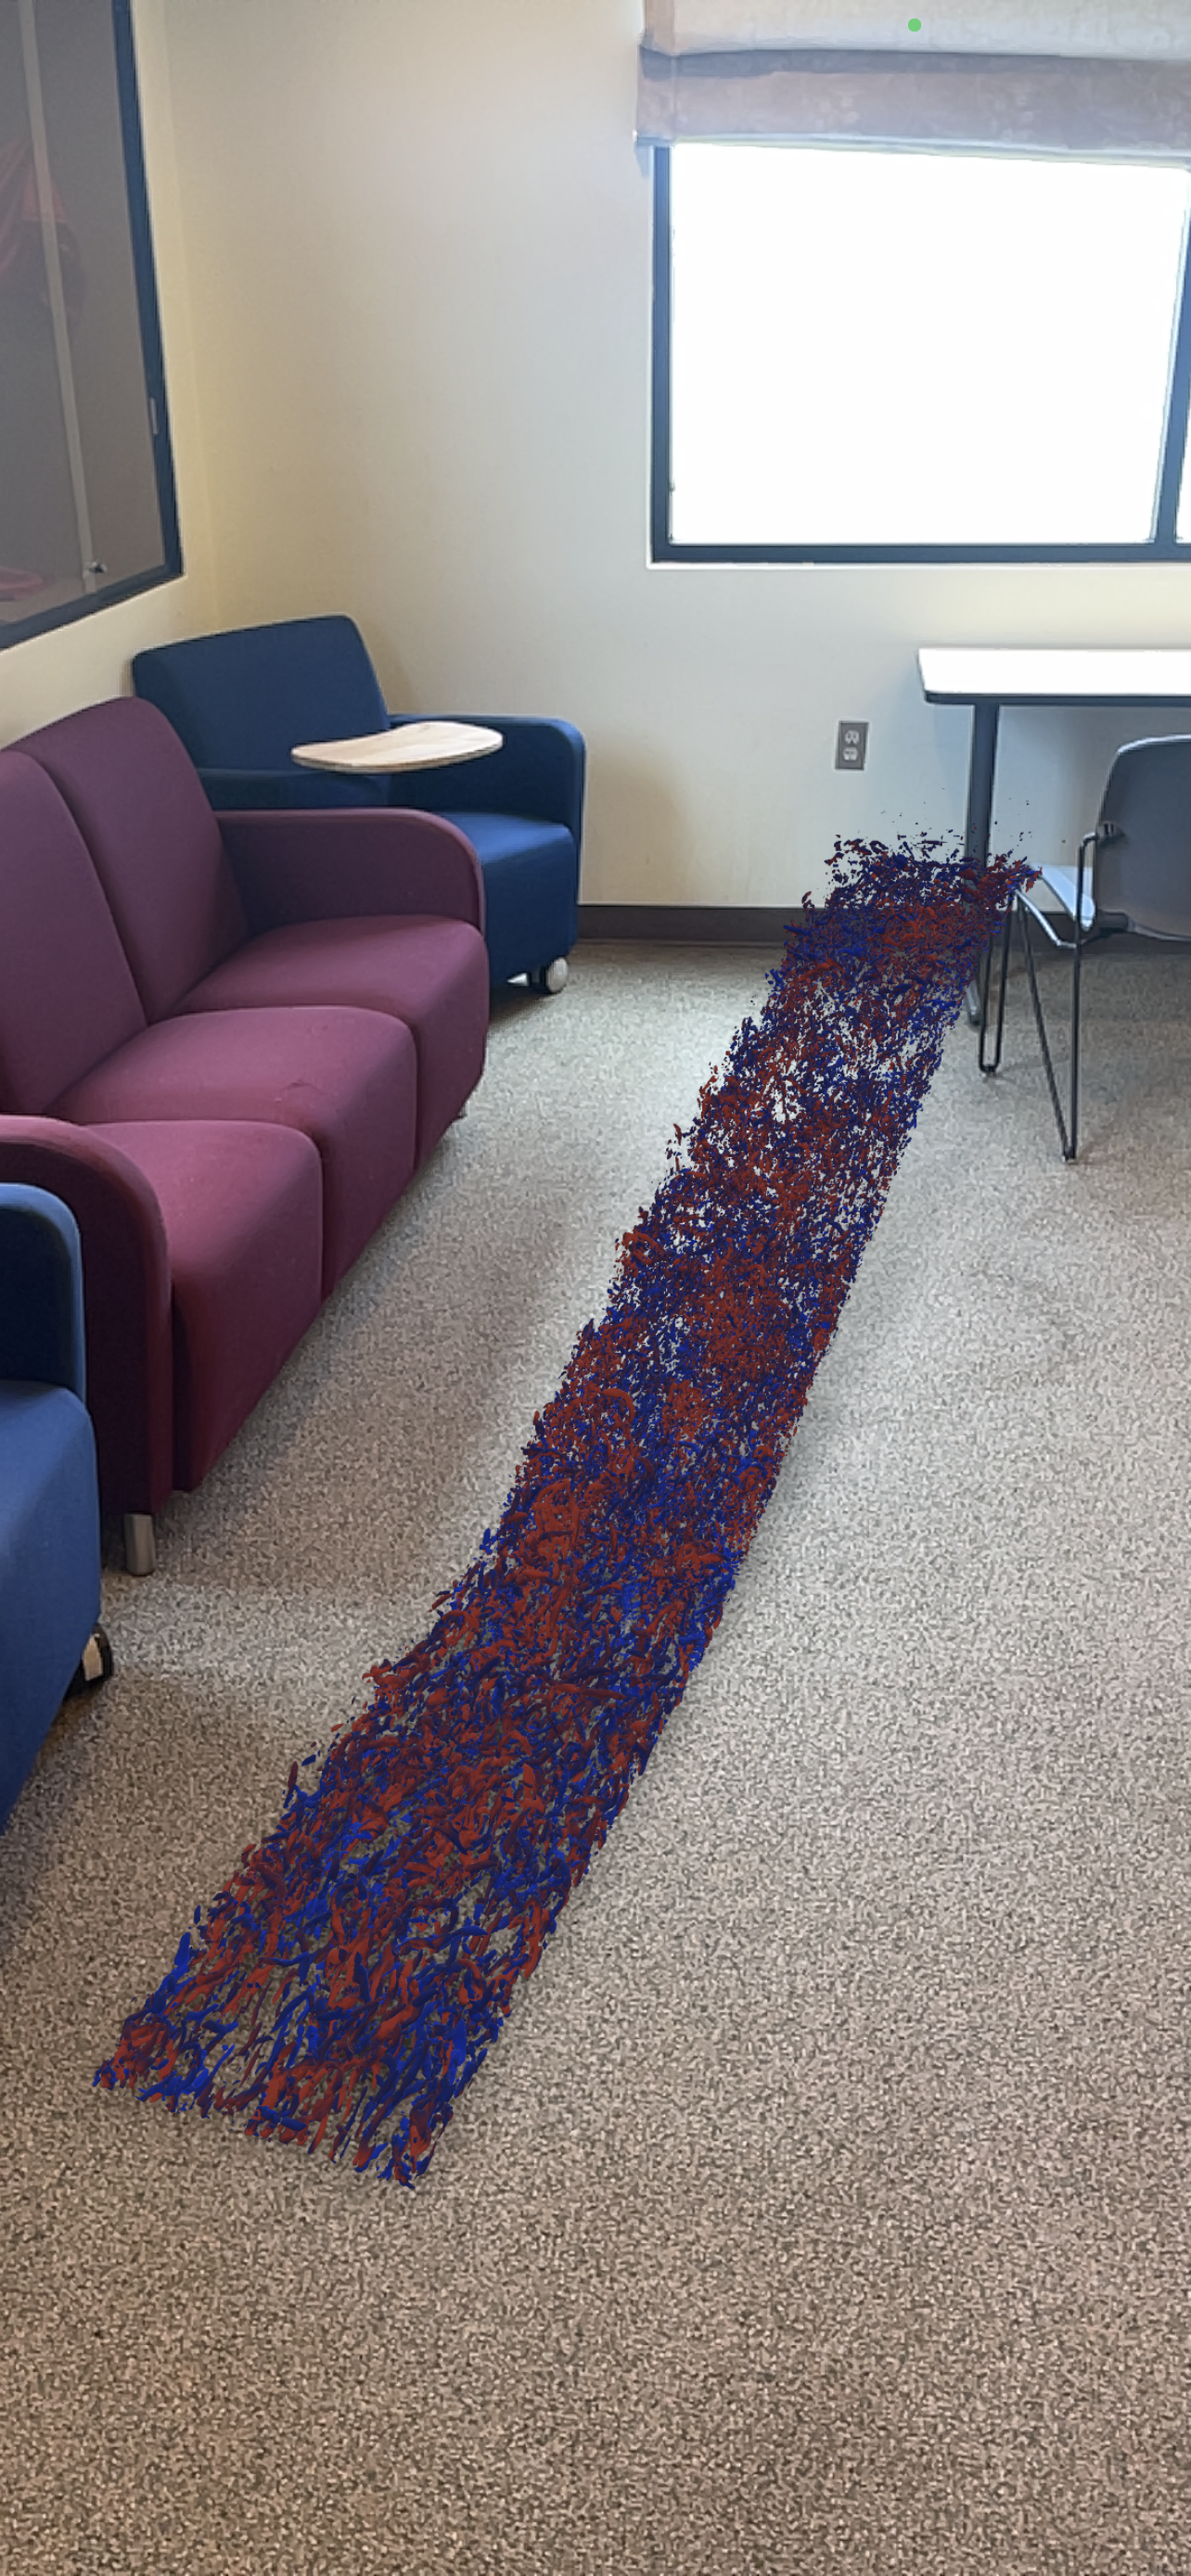
Figure 6.2b: AR object (iso-surfaces of thermal fluctuations) visualized through an iOS device.
7. References
Aoki, H. and Yamamoto, M., Development of 3-dimensional blade design system using virtual reality technique, Journal of Flow Visualization and Image Processing, vol. 7, no. 1, 2000.
Brown, G.L. and Roshko, A., On density effects and large structure in turbulent mixing layers, Journal of Fluid Mechanics, vol. 64, no. 4, pp. 775–816, 1974.
Bryson, S., Virtual reality: A definition history – a personal essay, ArXiv, vol. abs/1312.4322, 2013.
Eissele, M., Kreiser, M., and Ertl, T., Context-controlled flow visualization in augmented reality., Graphics Interface, pp. 89–96, 2008.
Flavián, C., Ibáñez-Sánchez, S., and Orús, C., The impact of virtual, augmented and mixed reality technologies on the customer experience, Journal of business research, vol. 100, pp. 547–560, 2019.
Friendly, M. and Denis, D.J., Milestones in the history of thematic cartography, statistical graphics, and data visualization, 2006
Hansen, C.D. and Johnson, C.R., Visualization handbook, Elsevier, 2011.
Hesselink, L., Digital image processing in flow visualization, Annual Review of Fluid Mechanics, vol. 20, no. 1, pp. 421–486, 1988.
Milgram, P. and Kishino, F., A taxonomy of mixed reality visual displays, IEICE TRANSACTIONS on Information and Systems, vol. 77, no. 12, pp. 1321–1329, 1994.
Paeres, D., Lagares, C.J., and Araya, G., The use of Augmented Reality (AR) in flow visualization, 74th Annual Meeting of the APS Division of Fluid Dynamics, 2021a, doi: https://doi.org/10.1103/APS.DFD.2021.GFM.V0028.
Paeres, D., Lagares, C.J., Santiago, J., Craig, A.B., Jansen, K., and Araya, G., Turbulent Coherent Structures via VR/AR, 73th Annual Meeting of the APS Division of Fluid Dynamics, 2020, doi: https://doi.org/10.1103/APS.DFD.2020.GFM.V0045
Paeres, D., Santiago, J., Lagares, C.J., Rivera, W., Craig, A.B., and Araya, G., Design of a Virtual Wind Tunnel for CFD Visualization, AIAA Scitech 2021 Forum, p. 1600, 2021b.
Paeres, D., Santiago, J., Lagares, C.J., Craig, A.B., and Araya, G., Visualization of turbulent events via Virtual/Augmented Reality. Journal of Flow Visualization & Image Processing (in press). 2023
Sherman, W.R., Craig, A.B., Baker, M.P., and Bushell, C., Scientific visualization, Allen B. Tucker Jr. (Ed.), The Computer Science and Engineering Handbook. Chapter 35, CRC Press, Boca Raton, FL., 1997.
Walcutt, N.L., Knörlein, B., Sgouros, T., Cetinic, I., and Omand, M.M., Virtual reality and oceanography: Overview, applications, and perspective, Frontiers in Marine Science, vol. 6, p. 644, 2019.
Winant, C.D. and Browand, F.K., Vortex pairing: the mechanism of turbulent mixing-layer growth at moderate Reynolds number, Journal of Fluid Mechanics, vol. 63, no. 2, pp. 237–255, 1974.