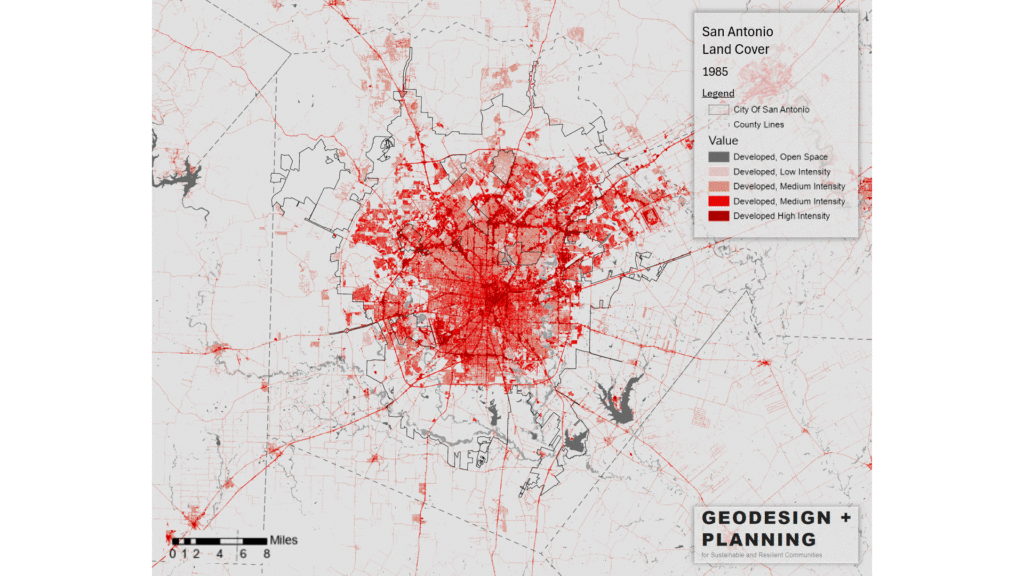
This project visualizes the rapid urbanization of San Antonio, Texas, along with other fast-growing cities in the state, through two animated visualizations that track land cover and tree canopy changes using 30-meter resolution NLCD data (https://www.mrlc.gov). The first visualization, covering the past 40 years, illustrates the city’s expansion over time, showing how developed areas have grown while natural landscapes have diminished. The second visualization, based on data from the past 20 years, focuses on changes in tree canopy, revealing the reduction in urban greenery. Due to the resolution of the data, the tree canopy changes appear less distinct, and a higher resolution mapping approach could provide more detailed insights. The rapid growth of San Antonio reflects broader trends seen across Texas, where expanding urban areas are consuming natural spaces at a fast pace, especially in recent decades.
This map was created by graduate research assistant Elliott Coleman under the supervision of Dr. Lee. These visualizations aim to raise awareness about the environmental impacts of urban sprawl and the loss of vital natural resources caused by urbanization. Data visualization is a powerful tool for understanding patterns and identifying trends. By transforming complex data into accessible, visual formats, we hope to encourage informed discussions on sustainable development and the importance of preserving our natural environments amidst growing urban populations.


